Haddington Running Club
Club Information
About the Club
Membership
Club Kit
Contact
Davy Jones’ Locker
“The Chaser”
1996
Scottish Athletics Affiliation and Welfare
Scottish Athletics Affiliation and Welfare
Equality
Social Media
Club Races
Club Championship
Haddington Trail Half Marathon
Haddington 5k & 10k Road Races
Haddington Half Marathon
Summer Series Leg
Carfraemill to Gifford Run
Goats Gallop
Results
Club Race Results
Haddington 5k
2017
Haddington 10k
2015
2016
2017
Haddington Half Marathon
2015
2016
2017
Club Member Results
Recent Club Member Results
Club Records
Manage Results
Results Help
Juniors
Jog Scotland
General Running Risk Assessment Checklist
Attached to
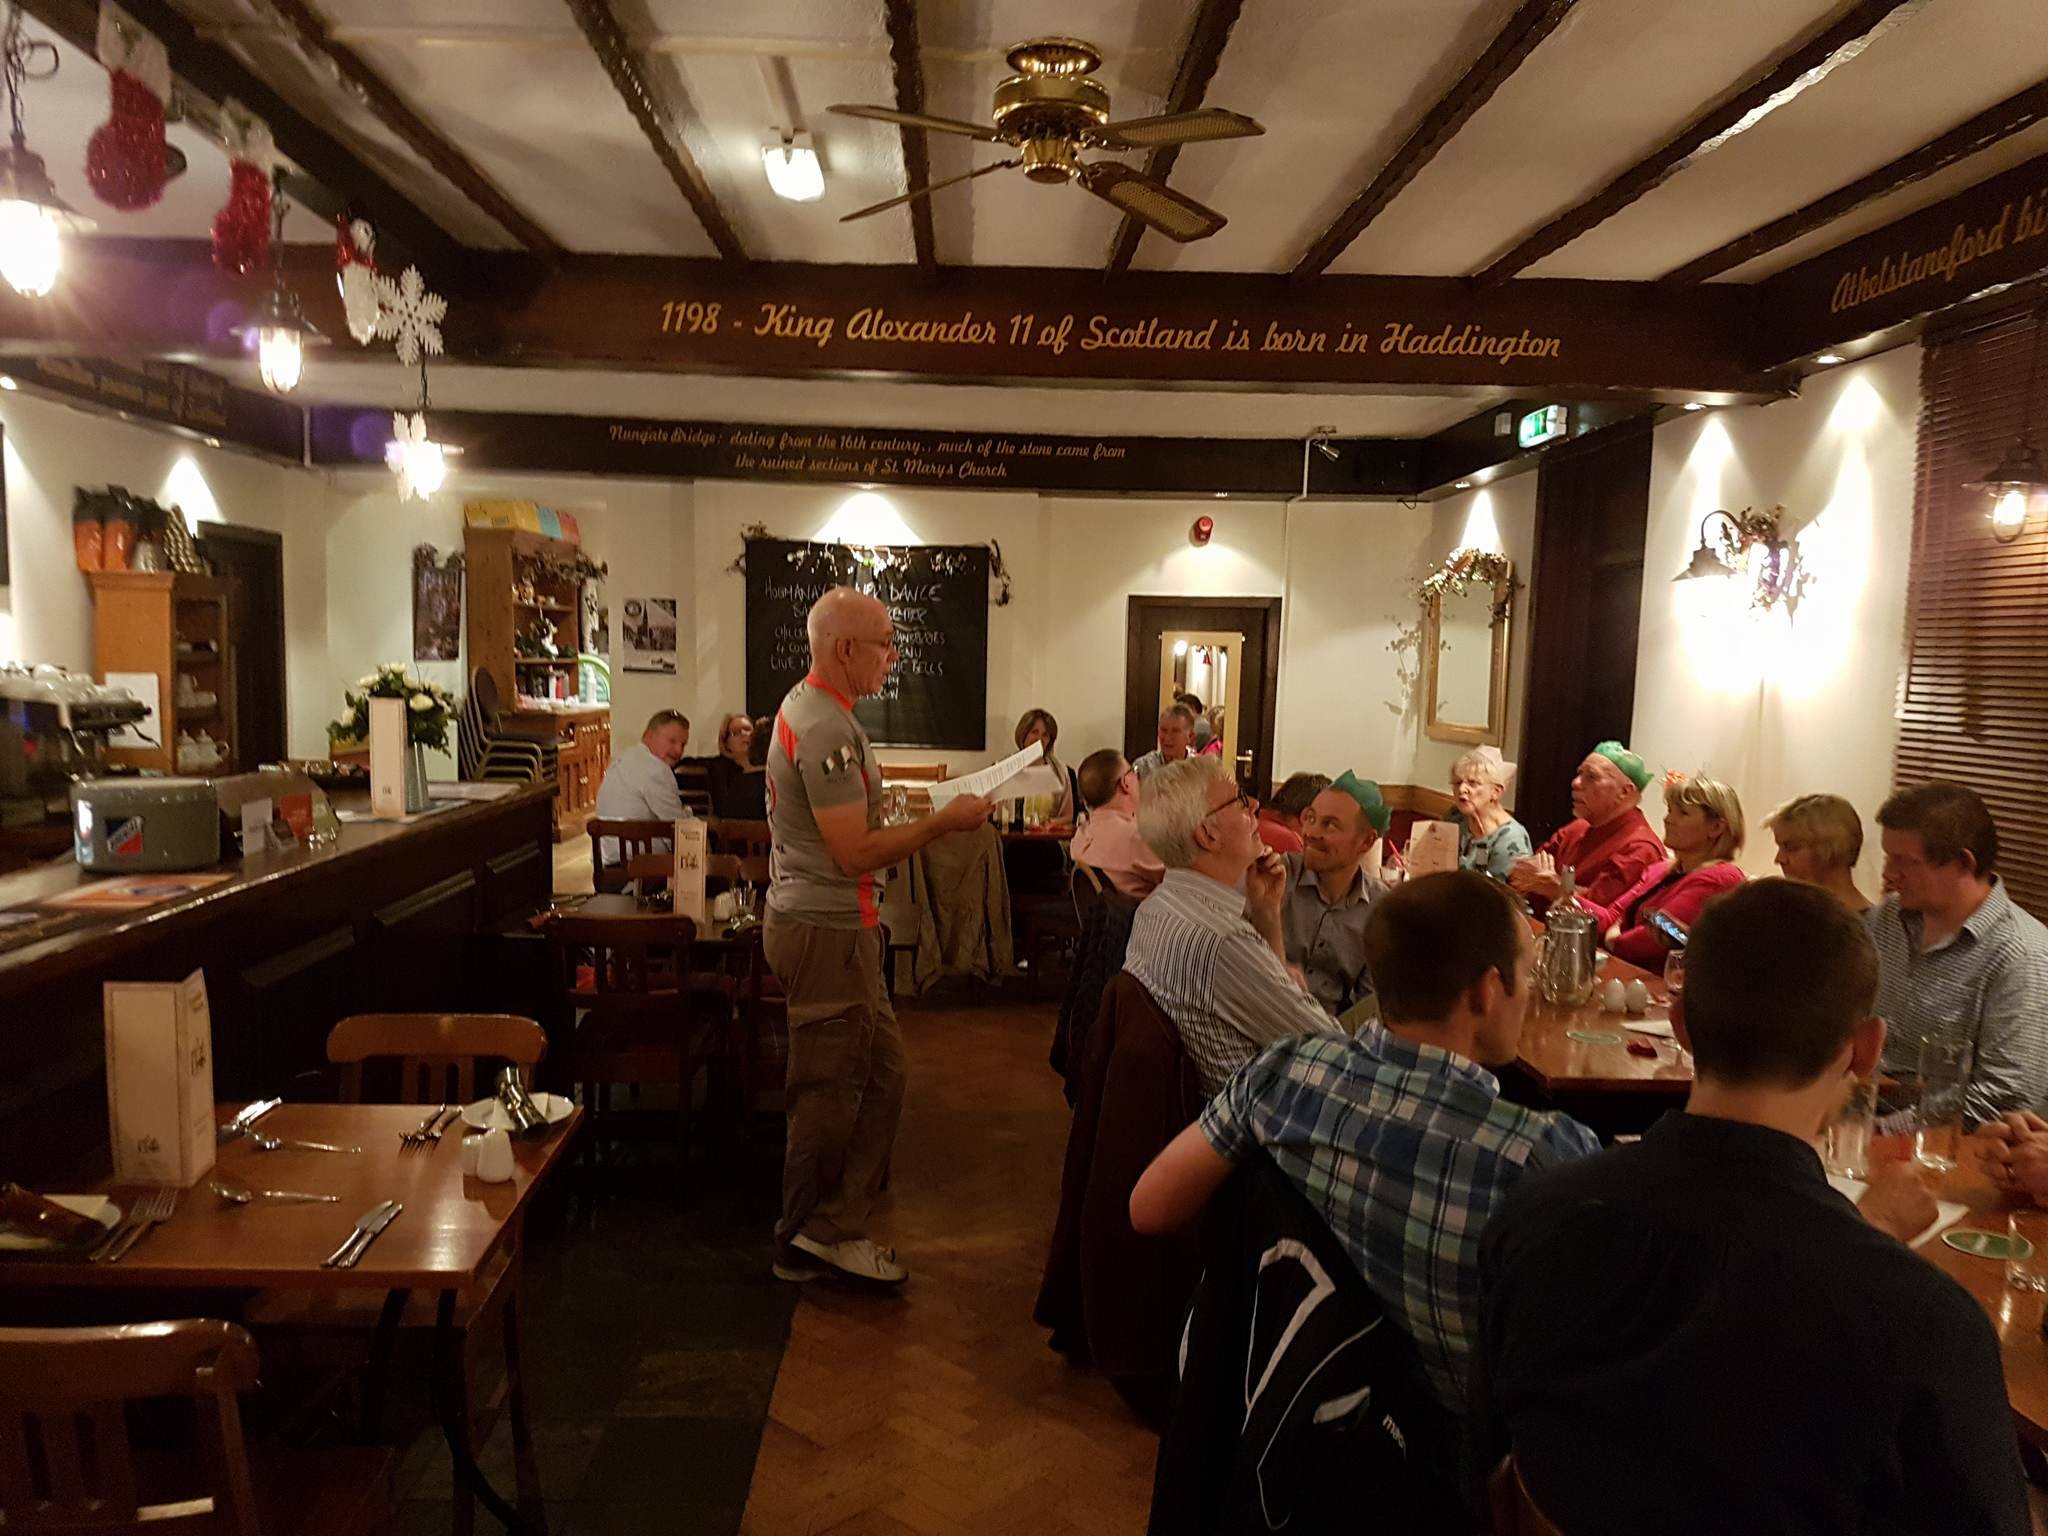
Christmas Dinner 2016
which was posted on
15 December 2016
.
View full image.